Introduction to Recommendations
- This is a reprint from an article by Directed Edge co-founder Scott Wheeler that originally appeared in two parts in Gründerszene (Part 1, Part 2)
I still buy vinyl records. There’s something nostalgic about friction between a needle and wax producing my music in the age of iTunes. When I buy records I don’t go to one of the Kreuzberg outlets near to where I live, I go across town to Rotation Records. Why? Because of Niko.
Niko owns Rotation and his knowledge of the the genres that he stocks make it worth taking 90 minutes out of my day to get his input. Niko doesn’t know who I am, but if I ask and tell him a little about the records I’ve bought in the past, he can get a pretty good idea of what I might be interested in. It’s in his interest to know his stuff - it makes his customers buy more records and keeps them coming back to Rotation.
Recommendations have no doubt been a component of sales since the advent of commerce. But we do live in the age of iTunes, the age of Amazon, where millions of products are stored in far away warehouses and shipped through complicated, automated logistics. So, who is the “Niko” in the world of e-commerce?
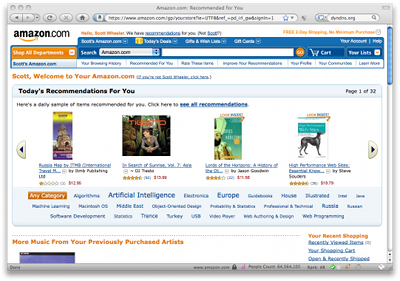
Amazon was one of the pioneers in the use of automatic recommendations to drive sales. $5 billion, or 25% of the annual sales come from suggesting products to users by showing related books or personalized music recommendations. iTunes’ “Genius” suggests music downloads and Last.fm’s recommender system builds personalized radio streams and shows related concerts. Berlin is home to at least three startups focusing on different elements of recommendations: Plista’s web personalization, Mufin’s music analysis and my own startup, Directed Edge’s, pluggable recommendations offered as a web-service.
But aside from large e-commerce sites and startups that themselves are focusing on recommendations, how are recommendations relevant to the larger startup world? In a survey by ChoiceStream in 2007, 45% of users surveyed were found to be more likely to shop at a store that provided product recommendations, and for users that spent more than $1,000 online in the previous six months, the number went up to a full 69%. The same survey showed that 41% of users were more likely to pay attention to advertising that was personalized to their tastes. In social media and news sites recommendations reduce bounce rates by showing related content within the site.
So that’s the “why”, now what about the “how?”
Collaborative Filtering
Collaborative filtering is the best known branch of recommender systems. In non-computer scientist terms it just means looking at histories of ratings, purchases and clicks and figuring out which products or users are similar to each other based on that.
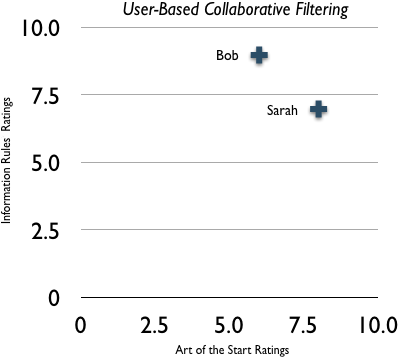
Let’s imagine that Bob and Sarah have both given ratings to “The Art of the Start” and “Information Rules”.
If we want to figure out how similar Bob and Sarah’s tastes are, we can plot their ratings on a graph:
If we recall a little school geometry, we can figure out how far apart their tastes are. (You do remember the Pythagorean theorem, don’t you?)
In linear algebra, the branch of mathematics that dominates collaborative filtering, is called the “euclidean norm” and is one of the simplest ways to measure how far apart two users’ tastes are. If we were to add a third user, Josh, and computed his distance from Bob and Sarah, we could say, “Josh’s taste is closer to Sarah’s than to Bob’s”.
In practice, these systems aren’t computed for two or three users and two books, they’re computed for hundreds, thousands, or even millions of products and users. But let’s keep things simple: If we had measured the distance between Bob and every other user in an online store, we could then say, “Here are the 10 users closest to Bob.” And from there we have a basis for delivering recommendations. There’s a pretty good chance that Bob will like some of the books that those other 10 people like him have purchased and that he doesn’t own yet.
But there’s a catch.
You see, every time a new book is added to the set of ratings above, a new dimension is added to the computations. Two books, two dimensions; three books, three dimensions; a million books, a million dimensions. And if there were 100,000 books and 100,000 users, measuring the distance between each user would take at least 15 billion mathematical operations. In computer science, that computation is said to scale “quadratically”. In practical terms, it means just throwing more hardware at the problem won’t make it scale.
Because of the computational limitations of user-based collaborative filtering, around 2001 there was a shift to what’s known as “item-based collaborative filtering”. In item based collaborative filtering, instead of first finding related users and then using those users to find related products or content, item-based strategies first compute the similarity of every item and use that to recommend products.
Let’s take the ratings above, but add a third book, “Blue Ocean Strategy” and assume that Bob gave it a rating of 5 and Sarah a rating of 7.
Now, instead of seeing how similar Bob and Sarah are, we see how similar each product is to the others. To deliver recommendations for Bob we can then see which product he’s liked and jump to products which are similar to those.
Item-based collaborative filtering works well when the set of items, or products, is fairly static and smaller than the number of users, as is typical in an online store. The advantage of item-based strategies is that we can quickly compute recommendations for Bob without having to first compare him to every other user of the store. If Bob has rated 100 items, we can look at his top 10 highest rated items, find the items related to those that he hasn’t purchased and rank them based on how similar they are to his top 10.
To do this, however, item-based collaborative filtering requires a pre-processing step where the similarity of every product is first computed. Even some of the big names in collaborative filtering - Amazon, Last.fm, for instance - until recently didn’t update their recommendations more often than every few days or once a week because computing the item similarity matrix takes so long.
The complexity of this computation is the same as creating user-based recommendations; it’s the same 15 billion mathematical operations. One of the most active areas of recommendations research, and one of the defining characteristics of commercial recommender systems, is mitigating this, “curse of dimensionality”, as some papers call it, a problem common to collaborative filtering, image processing and natural language processing.
Graph-Based Recommendations
In computer science lingo, a graph is just a set of connections between things. Those connections are called “edges”. A “directed edge” is a link from one item to another, like a link from one web page to another, and the term my company’s name comes from. One of the most well known applications of graph theory is used in Google’s PageRank, since it ranks the importance of pages based on who links to them and what they link to.
Let’s imagine a small set of friends in a social network:
Bob is a friend of Sarah, and Sarah is a friend of Amy, who is a friend of Josh. Peter is friends with both Amy and Josh. Intuitively, we can guess that Peter and Sarah might get along well since they share some common friends, even though there’s no explicit connection between them.
Graph-based recommendation systems are a less widely known subfield of recommender systems, but they deliver recommendations based on the connections between people or products. For the mathematically inclined, it can be shown that you in fact can model any traditional collaborative filtering system within a graph. For instance, if we go back to our list of ratings, we can imagine a connection between Bob and “The Art of the Start”. Graph connections, or “edges” can also have weights - meaning, they tell us how strong the connection between those two items is. So Bob has a connection to “The Art of the Start” with a weight of 8, and a connection to “Information Rules” with a weight of 7.
By looking at how strongly Bob is connected to the products in his “neighborhood” of the connection structure, just like we could guess that Peter and Sarah might get along well, we can also guess which products Bob is likely to be interested in. In some cases, graphs provide a way to find more obscure links from people to products because there can be a path from Bob through Peter to, say, “Blue Ocean Strategy”.
When we want to see how similar products are in item-based collaborative filtering, we first have to compare every product to every other product, as noted above. In a graph, we can accomplish the same by stepping back one step in the connection structure, to every user that has bought “Information Rules” and then step forward from each of those users to get a full set of “co-purchased” items. Rather than having to iterate over every product, we can quickly build the set of potential matches and often deliver recommendations in real-time without a batch processing step.
So, those are the foundations of our electronic “Niko” in the digital age. For a more technical introduction to recommender systems, check out O’Reilly’s Programming Collective Intelligence.


